Abstract
We evaluate fourteen open-source deepfake-detection models on a synthetic-face benchmark of approximately 26,500 face crops balanced across 12 demographic cells (skin tone by gender). For our generator we used a Stable Diffusion XL and InstantID pairing. In the initial evaluation (Phase 1), two detectors, DMimageDetection (Corvi et al., ICASSP 2023) and the fusion checkpoint of the GRIP-UNINA ClipBased-SyntheticImageDetection repository (Cozzolino et al., CVPRW 2024), saturated at AUC 1.000. Perfect detection on a newly constructed benchmark is unusual; it implies that the detector may be assessing an element other than synthetic artifacts. We hypothesized a format confound: our initial lack of standardization in image encoding, real images encoded via OpenCV (BGR, quality factor 95) and synthetic images via PIL (RGB, quality factor 92), may have given detectors implicit access to a near-perfect class label embedded in the encoder identity.
In Phase 2 we tested this hypothesis. We standardized the encoding of a 2,400-frame subset of our real and synthetic images and re-evaluated the top eight detectors from the initial benchmark. Additionally, we mimicked the conditions of real-world platforms to assess the detectors outside a lab setting, matching the JPEG parameters, color channel order, and decode-encode cycle of TikTok, Instagram, and Facebook on the same subset. On the standardized subset, DMimageDetection collapsed from AUC 1.000 to 0.34, and the ClipBased fusion checkpoint collapsed similarly. Six other detectors lost less than 12 AUC points. As a sanity check, a clean-native control reproduced the Phase 1 AUC of every model, isolating byte-level format normalization as the cause of the perfect scores.
Two findings. First, the two perfect detectors in Phase 1 had been reading the encoder identity baked into our benchmark, not the synthesis signal. Second, the remaining six detectors lost less than 12 AUC points under social-media re-encoding, a smaller production gap but still meaningful for a procurement decision.
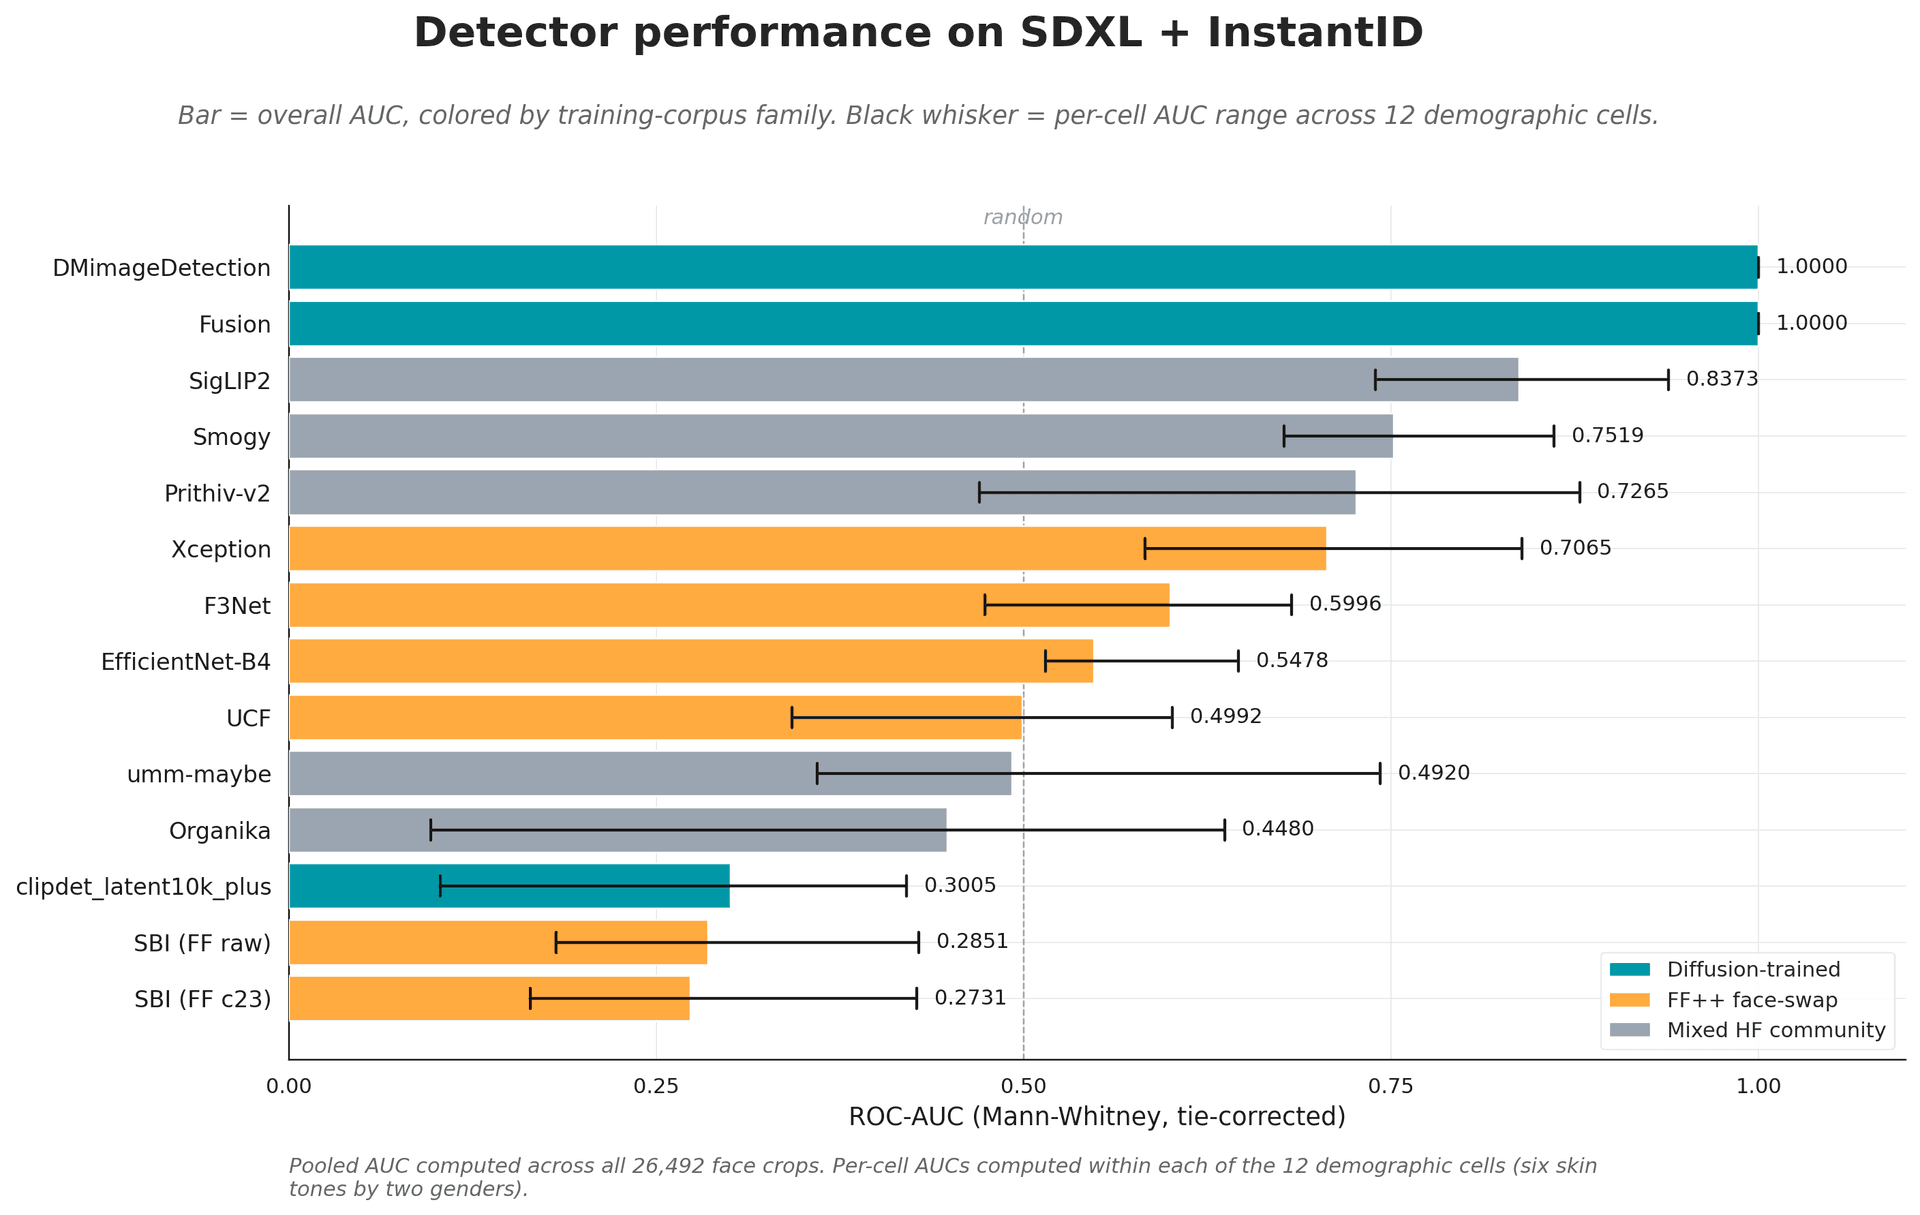
Source: Margen open-source detector benchmark, 14 detectors, Phase 1.
A perfect score is a warning, not a result
Detector benchmarks, in both industry and academia, routinely report AUC (area under the ROC curve, where 1.0 is perfect separation of real from synthetic and 0.5 is a coin flip) between 0.95 and 0.99 on in-distribution test splits, and real-world deployments just as routinely report large gaps against those published numbers. Two recent studies have quantified the gap: Deepfake-Eval-2024 (Chandra et al., 2025) reports leading open-source detectors at roughly 78 percent accuracy on in-the-wild deepfakes, with AUC falling about 45 percent for image models against their published figures. The gap is well documented. Less well characterized is what mechanism produces it, and whether the published numbers can be trusted at face value before deployment shift even enters the picture.
Phase 1 produced a usable benchmark, and it also produced a suspicious result. Evaluated on the corpus, fourteen detectors ranged from chance-level performance to apparent saturation, with DMimageDetection and the ClipBased fusion checkpoint both reporting AUC 1.000. Saturation at a perfect score on a newly constructed corpus is consistent with one of two scenarios. Either the corpus is too easy and the detector has effectively memorized the relevant generator artifacts, or the detector is exploiting a benchmark-specific feature unrelated to the synthesis signal. Both warrant scrutiny before any AUC claim derived from such a benchmark is acted on, and Phase 2 was designed to distinguish between them.
| Detector | Training family | Clean AUC | Clean-board tier |
|---|---|---|---|
| DMimageDetection | Diffusion-trained | 1.0000 | Top of clean board |
| Fusion | Diffusion-trained | 1.0000 | Top of clean board |
| SigLIP2 | Mixed community | 0.8373 | Mid clean board |
| Smogy | Mixed community | 0.7519 | Mid clean board |
| Xception | Face-swap | 0.7065 | Mid clean board |
| F3Net | Face-swap | 0.5996 | Near random |
| UCF | Face-swap | 0.4992 | Near random |
| clipdet_latent10k | Diffusion-trained | 0.3005 | Near random |
| SBI (FF c23) | Face-swap | 0.2731 | Near random |
Phase 1 ROC-AUC on the open-source detectors. Six detectors operating at chance level were excluded from Phase 2, since further perturbation would add no evaluative signal; eight carried forward.
The format-confound hypothesis
In Phase 1, real and synthetic images had entered the corpus through different software encoders by default: real images via OpenCV (BGR, JPEG quality factor 95) and synthetic images via PIL (RGB, JPEG quality factor 92). The mismatch was an unintended consequence of the standard libraries each pipeline used, and it became the central object of the investigation. Those two encoder paths produce subtly different JPEG byte structures, so a detector reading data with this mismatch may have learned to discriminate the encoder identity rather than the synthesis signal.
To test that, Phase 2 applied a unified re-encoding pipeline to a cell-balanced 2,400-frame subset of the Phase 1 corpus, 200 real and 200 synthetic per cell. Each base frame is processed into 17 conditions: one clean reference condition (PIL-encoded JPEG at quality factor 95, uniform across real and synthetic, which is the condition that tests the hypothesis directly), 12 single-axis conditions spanning JPEG quality factor, color-channel order, and resize algorithm, and four multi-axis pipelines emulating TikTok, Instagram, Facebook, and a consolidated platform ingest sequence. In total, 2,400 frames by 17 conditions gives 40,800 evaluation cells per detector. If the Phase 1 saturation was a format confound, format-normalized evaluation should cause the saturated detectors to collapse toward random.
The control itself is a few lines. Score the detector as-is, then re-encode both classes through one pipeline and score again. Whatever the gap is, that is the share of the accuracy that was reading format rather than synthesis.
1from sklearn.metrics import roc_auc_score2# Score as-is: real and synthetic arrived through different encoders4auc_raw = roc_auc_score(y_true, detector.score(images))5# Re-encode every image through ONE pipeline (PIL JPEG, QF=95, RGB), score again7parity = [reencode(img, codec="jpeg", quality=95) for img in images]8auc_parity = roc_auc_score(y_true, detector.score(parity))9# The gap is the "skill" that was reading encoder identity, not synthesis11print(round(auc_raw - auc_parity, 3))
AUC 1.000 to 0.34
They did collapse. Under the clean uniform-JPEG condition, the two CLIP-probe detectors that had saturated at 1.000 fell to near-random, DMimageDetection to AUC 0.34, a loss of roughly 66 AUC points. The collapse magnitude is far larger than for the next-most-affected detector, and the six other retained detectors each lost less than 12 AUC points. Stated plainly, the Phase 1 saturation was, in retrospect, a measurement of how perfectly two detectors had learned the encoder mismatch, not the synthesis signal.
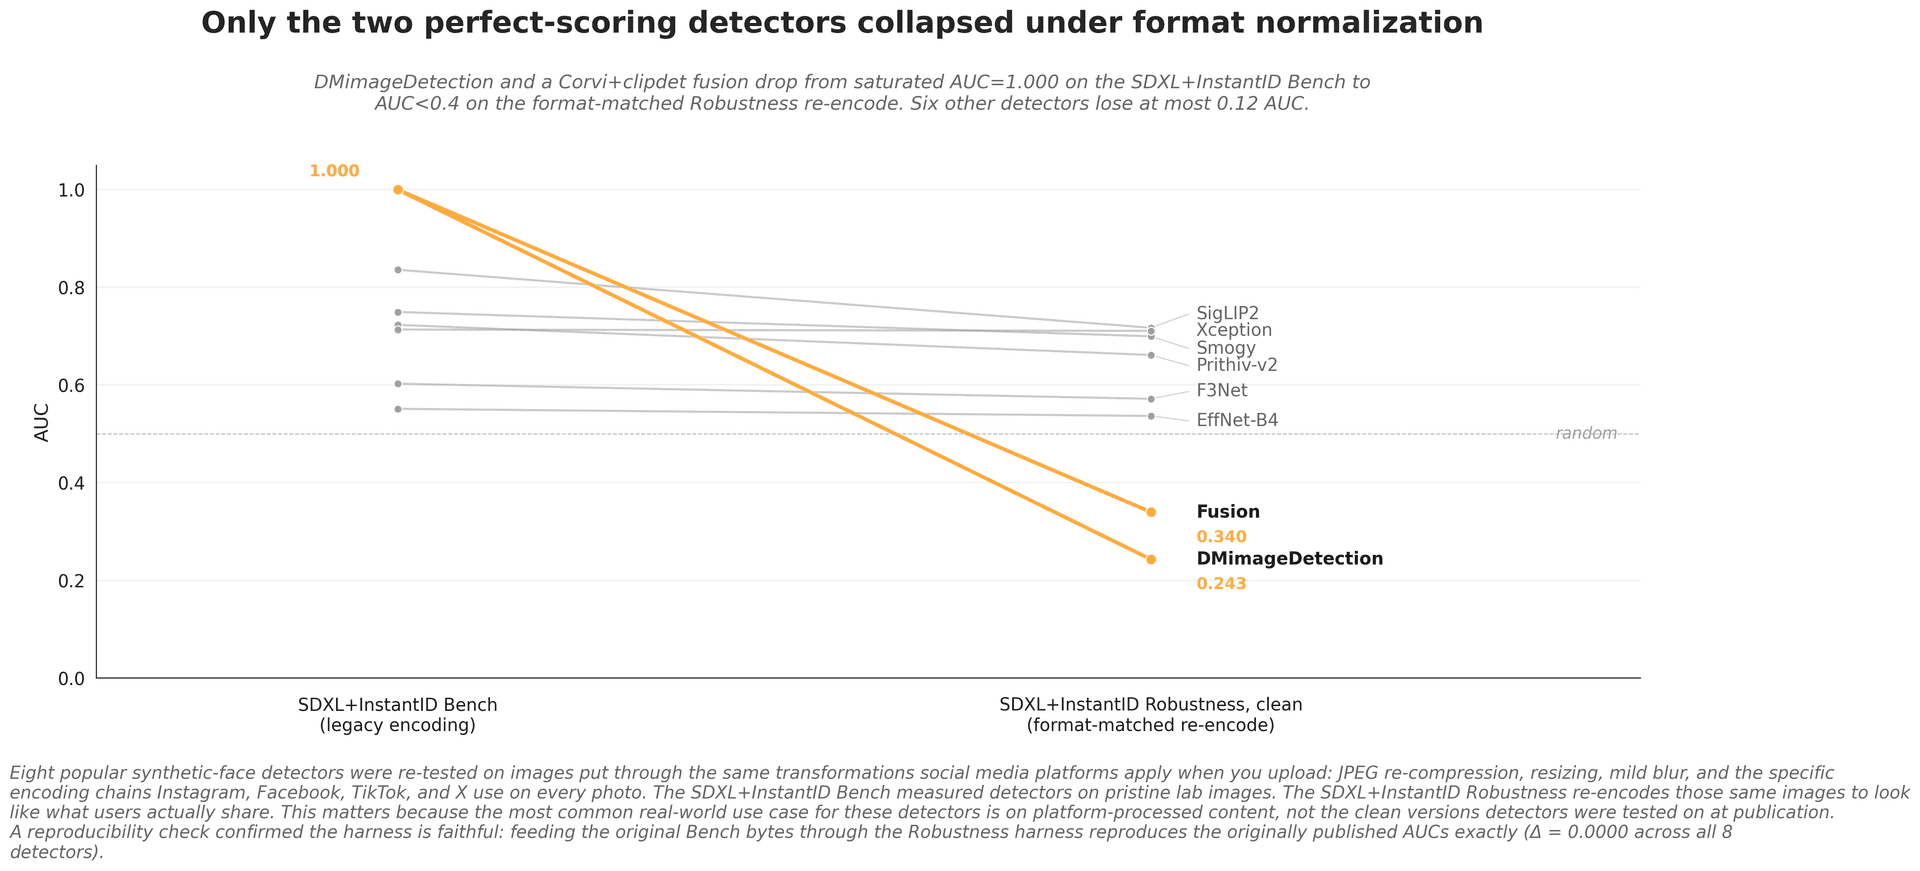
What makes the attribution hold is the control. Passing the original Phase 1 bytes through the Phase 2 harness with no re-encoding, the clean-native condition reproduces the Phase 1 AUC to four decimal places (a difference under 0.0001) for all eight detectors. That eliminates harness drift between the two phases as an explanation for the delta, leaving the byte-level re-encoding as the only remaining variable. We therefore attribute the collapse to the format normalization itself, which is precisely what the hypothesis predicted. Per-cell AUC was computed with Mann-Whitney and Hanley-McNeil confidence intervals, paired comparisons with the DeLong test, and the hypotheses were pre-registered before the Phase 2 results were finalized.
Per-cell results
Pooled AUC hides subgroup failure, so every result is broken out across the 12 cells (six skin tones by two genders) and the spread is reported, not the average. Skin-tone labels come from a Gemini-based labeler with human review on ambiguous cases; those labels are imperfect, and per-cell results should be read as directional rather than precise.
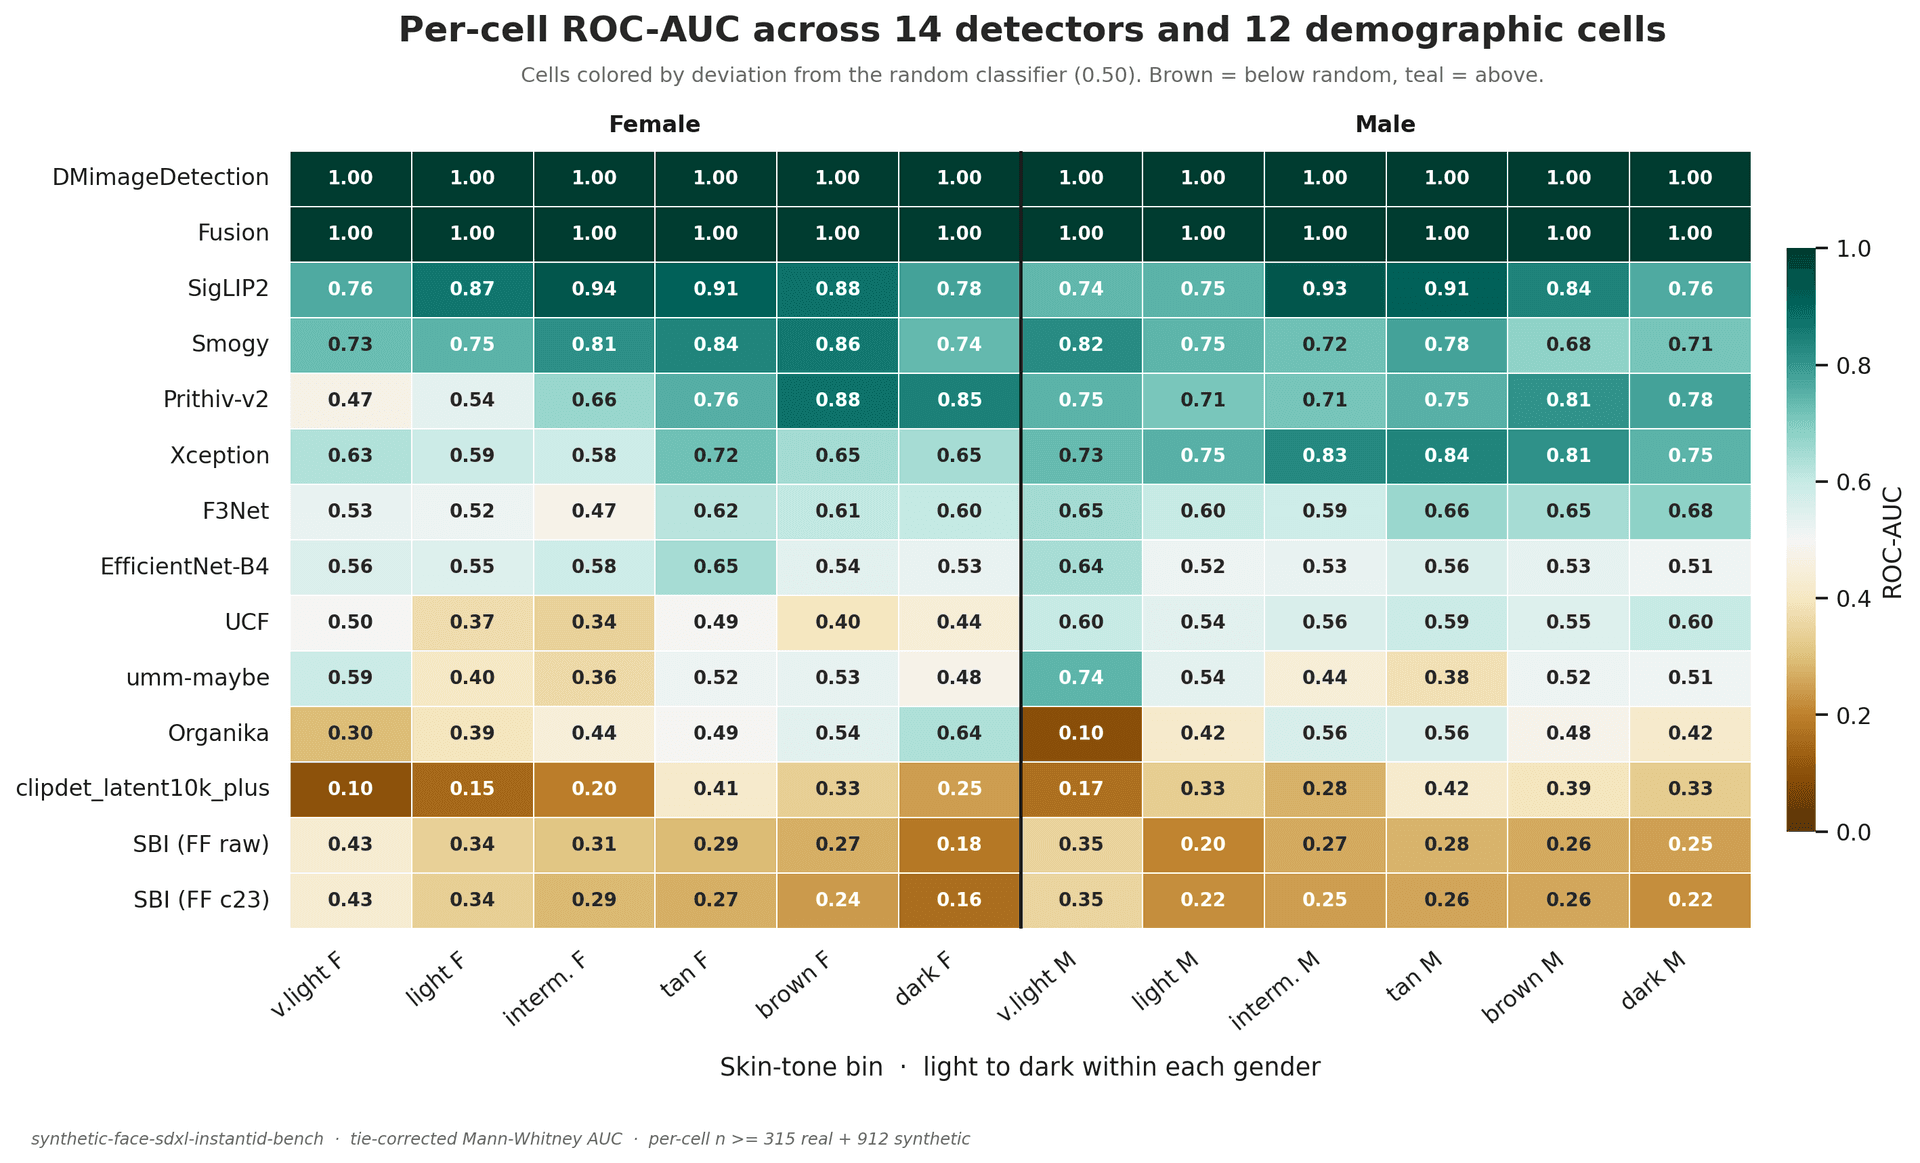
Source: Margen open-source detector benchmark, eight retained detectors. Directional, not precise.
Structural, not crafted
The adversarial-reality framing in recent detection literature (Ciftci et al., ICCV Workshops 2025) treats robustness failures as the result of crafted perturbations designed to evade detection. The mechanism documented here is structurally similar, a perturbation collapses detection AUC, but the perturbation is incidental rather than crafted. The social-media platform is not attempting to defeat the detector; it is normalizing content for its own delivery pipeline, and the byproduct is the loss of an encoder-identity discriminator the detector had implicitly learned. Effectively an unintentional adversary, the platform strips the very feature the detector was scoring on.
That suggests an extension to the taxonomy: crafted perturbation (intentional, optimized) and structural perturbation (incidental, a byproduct of normal operation). For procurement the structural class is arguably the more important one, because it is what every deployed detector encounters on every uploaded image, regardless of adversary intent.
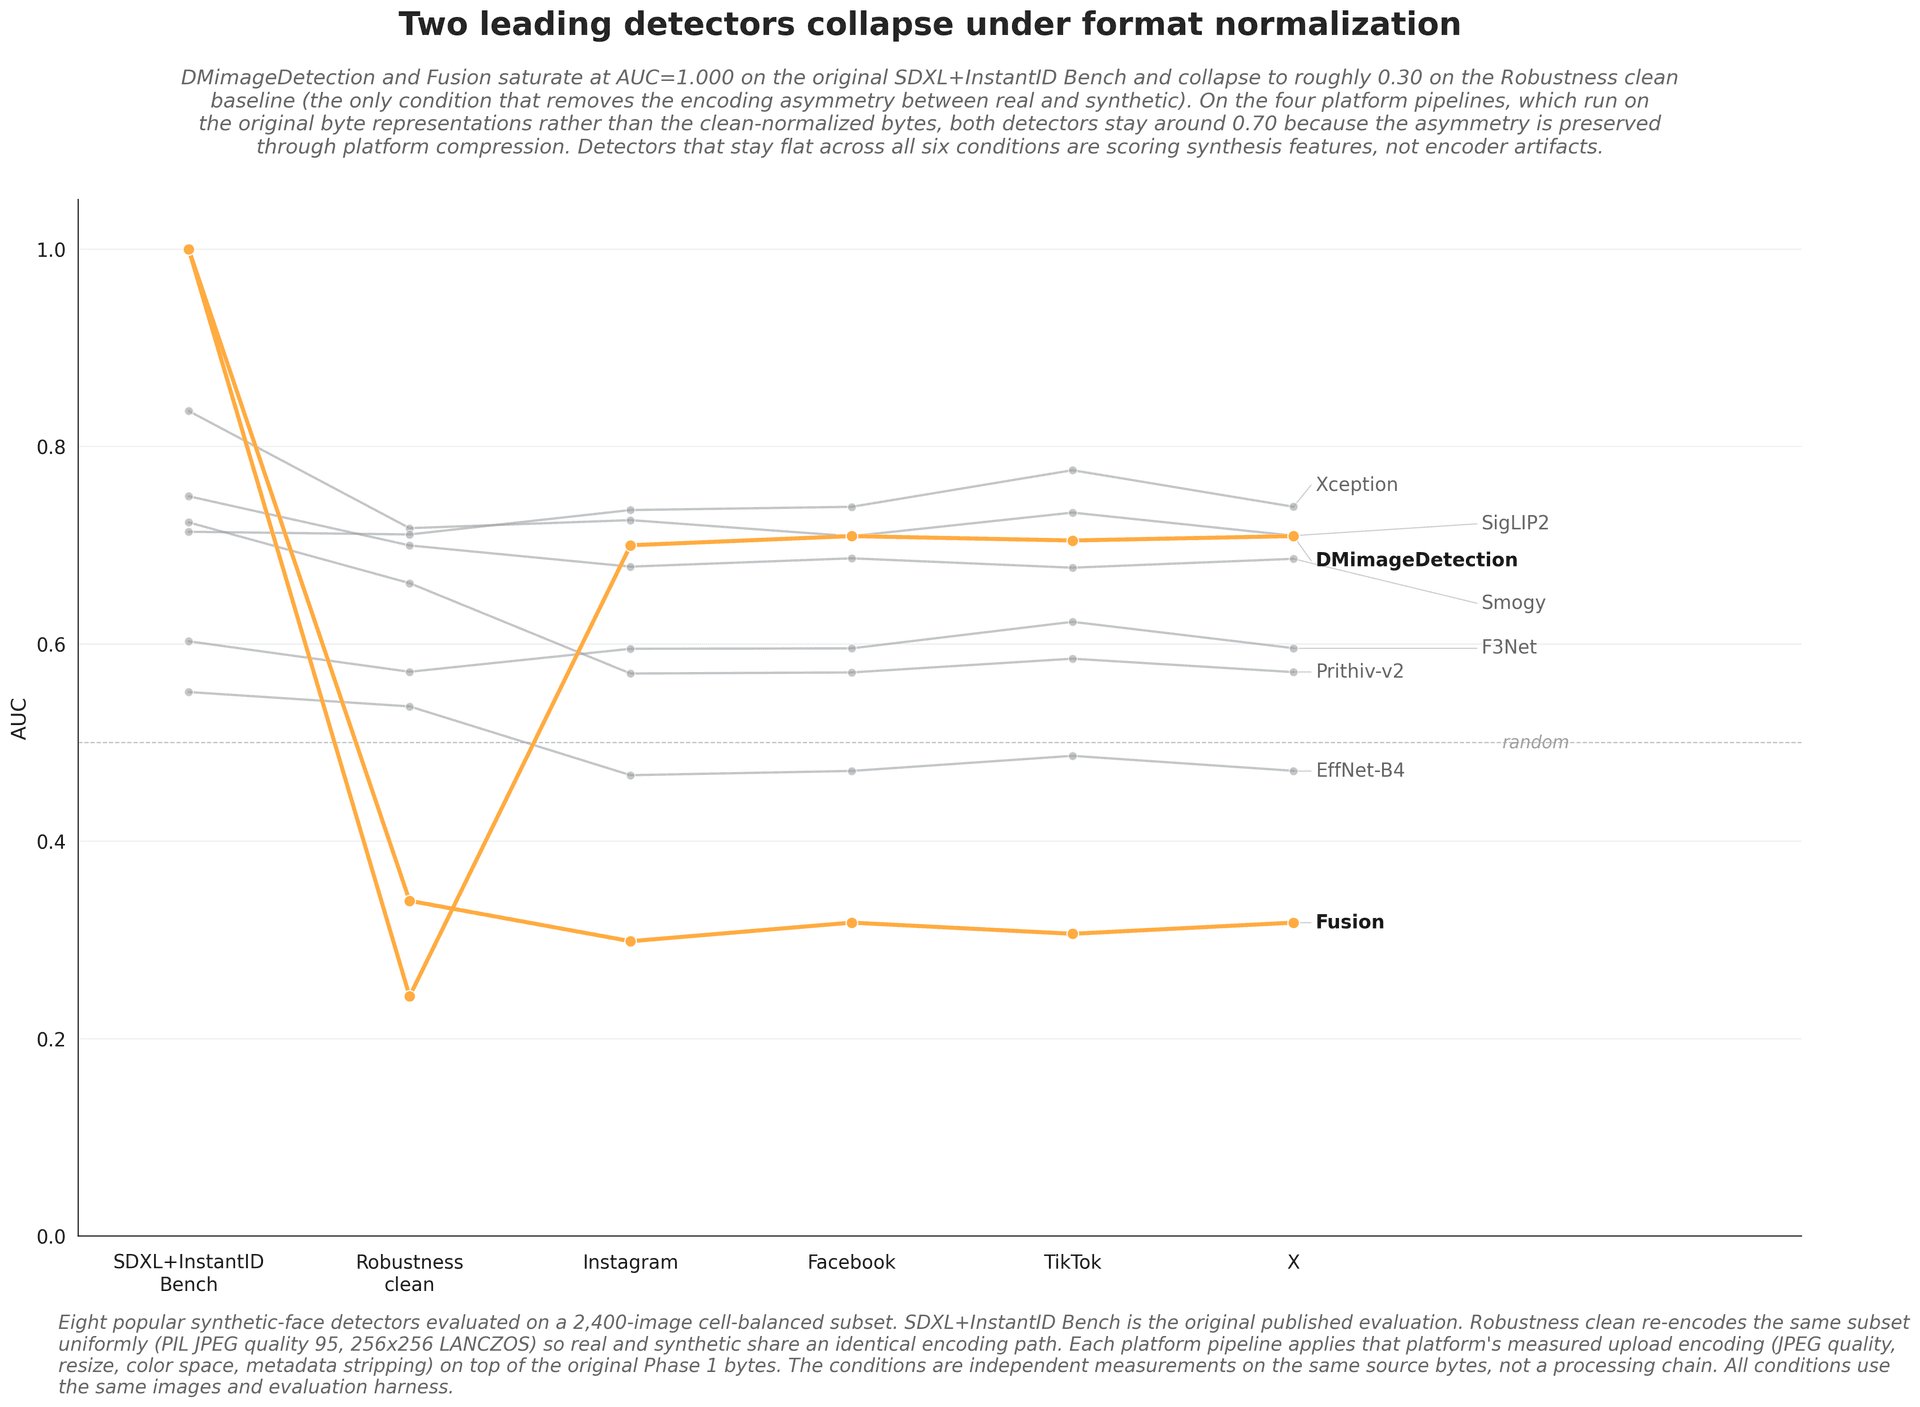
Layer-2 pipelines are emulations of documented platform processing, not captures from production ingest.
Implications for procurement
A detector reporting AUC at or above 0.95 on a published benchmark provides no information about how it will perform once content has been re-encoded by the platform on which it is deployed, and as Phase 1 showed, the published number may not even reflect actual detection capability on the benchmark itself. The format confound is one specific mechanism; the broader implication is that headline benchmark AUC is not a useful procurement signal in isolation. The Phase 1 to Phase 2 sequence is itself a procurement template: a saturated result should trigger a format-controlled follow-up before it is acted on. At minimum, an evaluation should include:
- A clean-native control, to detect format-mismatch confounds in the benchmark itself.
- A platform-realistic re-encoding sweep matching the deployment target, whichever platform the detector is meant to sit behind.
- Per-cell stratification on demographic axes, to detect fairness drift.
- A statistical methodology (DeLong, paired confidence intervals) for the AUC comparisons being made.
- Explicit scepticism toward AUC values approaching 1.000 on newly constructed benchmarks, regardless of the detector's published reputation.
One further distinction matters for a buyer. A detector that fails on metadata-stripped content but succeeds on signed content is, functionally, a metadata reader, not a synthesis detector. Deployed as a metadata reader it is a fast and reliable defense against cooperative generators and provides no signal on the adversarial, regenerated, or non-cooperative threat surface. The protocol in this paper measures the metadata-stripped case, which confirms a detector is reading synthesis signal; the metadata-verification rate on cooperative content is a separate axis that a procurement evaluation should measure alongside it. AUC is not the only number that misleads here, and we take up which statistic a buyer should actually optimize in AUC is the wrong number for identity verification.
What this evaluation does and does not measure
The synthetic content in this benchmark is generated via SDXL and InstantID and carries no C2PA manifest, SynthID watermark, or IPTC AI-source metadata. That is structurally consistent with how such models are deployed in adversarial conditions: self-hosted diffusion pipelines do not sign their outputs, and bad actors routinely run cooperative-generator output through a small diffusion model at low denoising strength to wipe any signing chain. The benchmark therefore evaluates detectors against the residual adversarial case the metadata stack cannot cover, the threat surface where ML detection is the sole defense. It does not measure accuracy on cooperative-generator output, nor on content where the metadata stack has been only partially stripped.
The limitations are named so that what the evaluation does not cover is as clear as what it does. Generator coverage is SDXL and InstantID only, a 2023-era architecture that is widely deployed and no longer the frontier; a subsequent release expands toward frontier generators. The detector pool is eight open-source models, with commercial-API detectors not evaluated in the published research. Twelve cells cover skin tone and gender only, with age not stratified. And the platform pipelines are emulations based on documented processing behaviour, not captures from live ingest. Every claim in the paper can be re-run by a reader with the published artifacts, and the clean-native reproduction is the lowest-cost sanity check on the whole method.
Run it against your own detector
The methodology here is reproducible by detector vendors as internal QA, and it is more directly relevant to deployment performance than the academic benchmark numbers most vendors publish. Building on that, the paper argues for the routine inclusion of platform-emulation perturbation suites in release QA, and for third-party adversarial evaluation as a procurement signal independent of vendor self-reporting. Both of those are things you can do now.
If you build a detector, the attack data behind this benchmark, and the frontier generations that followed it, are available off the shelf through the attack-data API: labeled real and synthetic imagery, delivered under one encoder, so the first thing you learn is whether your model is reading synthesis or format. If you deploy a detector, whether bought or built, a personalized evaluation runs your live system through the same protocol on data matched to your world, reports where it fails per condition and per group, and routes the working attacks to whoever owns the model. Either way, the question is the one this paper started with: not whether the detector scores well, but whether it reads a property the attacker cannot supply.
Margen does not sell a detector. We are an independent measurement layer that red-teams detection under adversarial, platform-realistic conditions and reports, with a number and a margin of error, where it holds and where it breaks.
Cite this paper
The benchmark is published openly with a permanent DOI. Cite the immutable record, not this page.
Cite this paper
Pick a format. Copy the string.
Babalola, D.. (2026). Deepfake Detector Robustness Under Social-Media Re-encoding. Zenodo. https://doi.org/10.5281/zenodo.20781389
Related reading
- Methodology notesAUC is the wrong number for identity verification.Thirteen published synthetic-ID detectors, measured on 6,948 passport-style images. Nine change rank the moment you measure what they actually catch rather than how they rank, and that gap is visible before a document has been through a single scanner.
- Fraud storiesA cloned voice that said the password, and the bank let it in.Reporters cloned their own voices and passed bank voiceprint authentication. Researchers defeated it with up to 99 percent success in six tries. The industry now concedes the control is beaten.
- ExplainersMeta's Muse watermark, and what it does not do for deepfake detection.Meta's Content Seal watermark labels the content Meta itself generates. That is useful, and it is not the same as detecting the deepfakes an attacker actually makes.